
September Market Update: Buyers Stayed Cautious

Buyers took their time in September. TRREB pointed to uncertainty around the economy, inflation and borrowing costs as reasons many held off. Sellers had to give buyers a clear reason to take the next step, starting with a price that made sense.
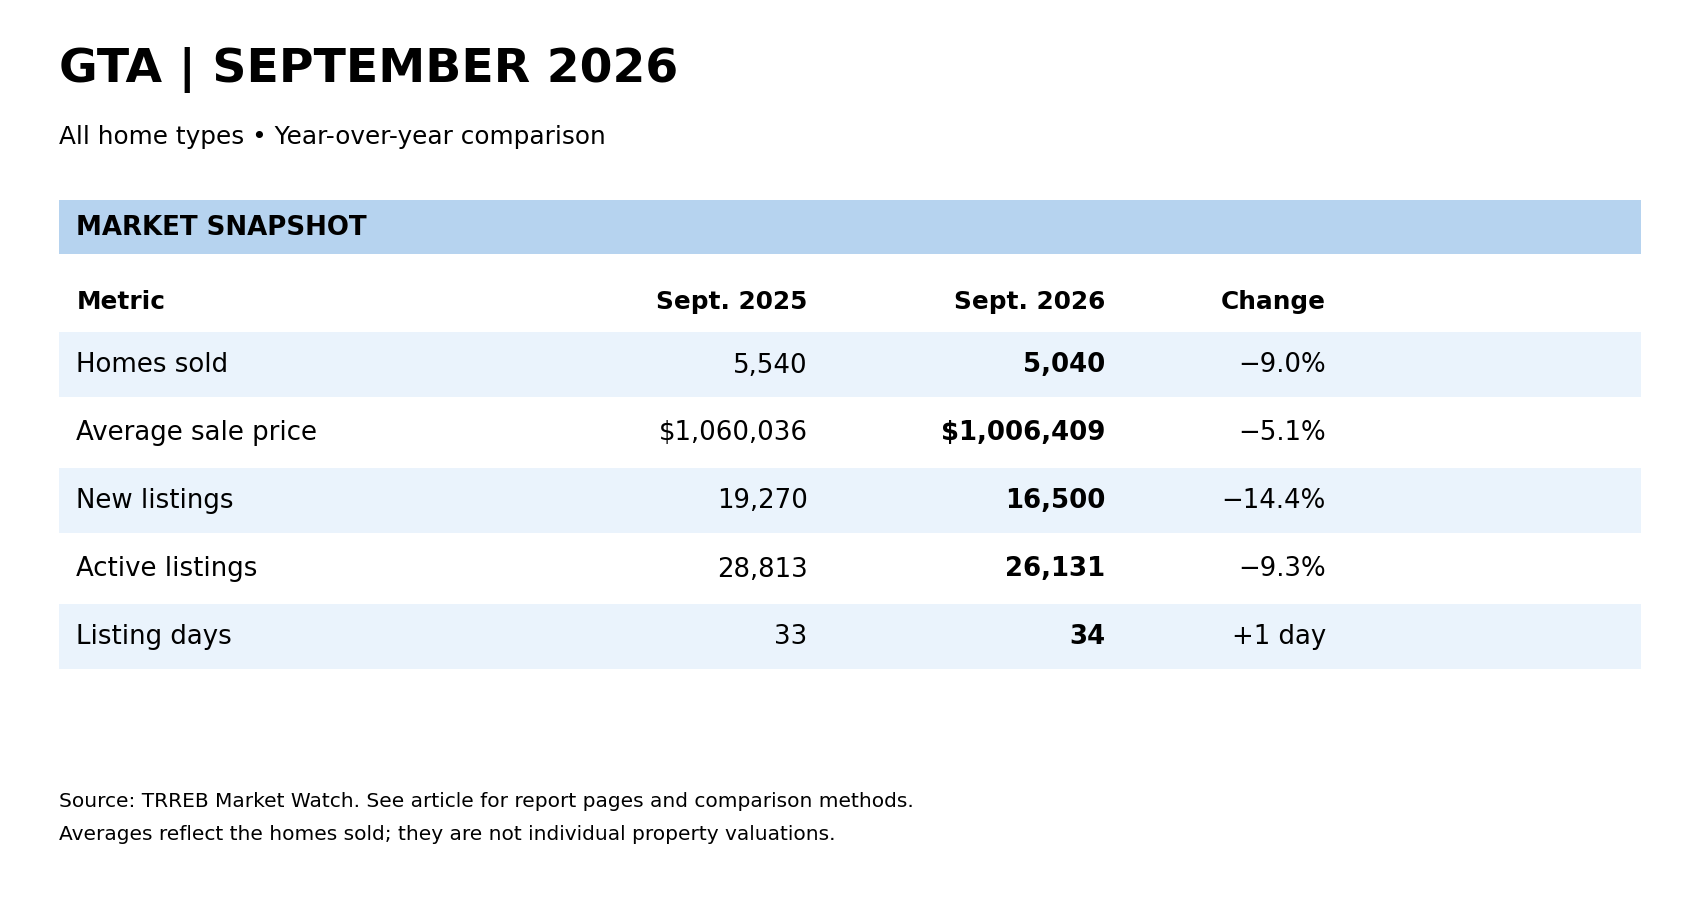
Across the GTA, 5,040 homes sold, down 9% from last September. Sellers added 16,500 new listings, down 14.4%, and the average sale price was $1,006,409, down 5.1%. There were fewer homes available than a year ago, but buyers still had 26,131 active listings to consider.
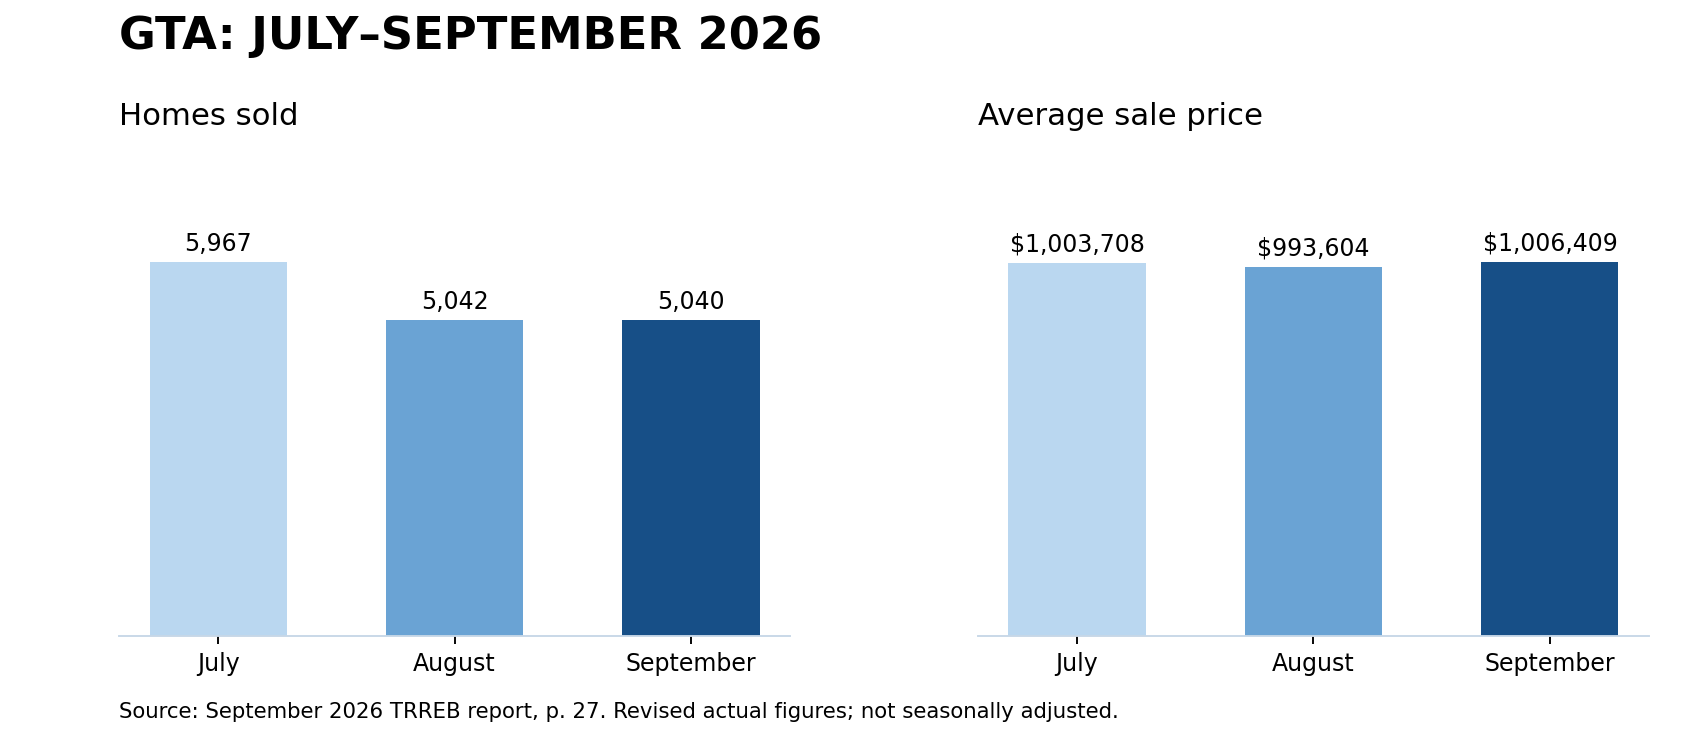
Compared with August, actual sales were almost unchanged and the average price rose 1.3%, using the revised figures in September’s report. After accounting for seasonal patterns, TRREB reported that sales, new listings and average prices all fell.
What this means for sellers
Buyers are comparing your home with everything else they can afford nearby. The asking price, condition and presentation all need to work together. If another home offers more for similar money, expect buyers to notice.
Allow time for the sale. The GTA’s average property days on market was 51 days, which accounts for qualifying relistings under the same seller and brokerage. That gives a fuller picture than the 34-day listing average. Plan your next purchase and moving dates with enough room to handle a longer sale.
What this means for buyers
You have room to compare homes and negotiate. Across the GTA, sold listings averaged 34 days on the market, giving you a useful starting point when planning your search. Some homes move faster, especially when the asking price matches recent sales and the property shows well.
Look at what comparable homes actually sold for, how the property has been maintained and what it will cost you each month. A lower purchase price helps most when the home also fits your budget and the way you want to live.
Mississauga
Mississauga recorded 468 sales at an average price of $929,600. Sellers brought 1,371 homes to market, and 408 remained available at month-end. Sold listings averaged 36 days.
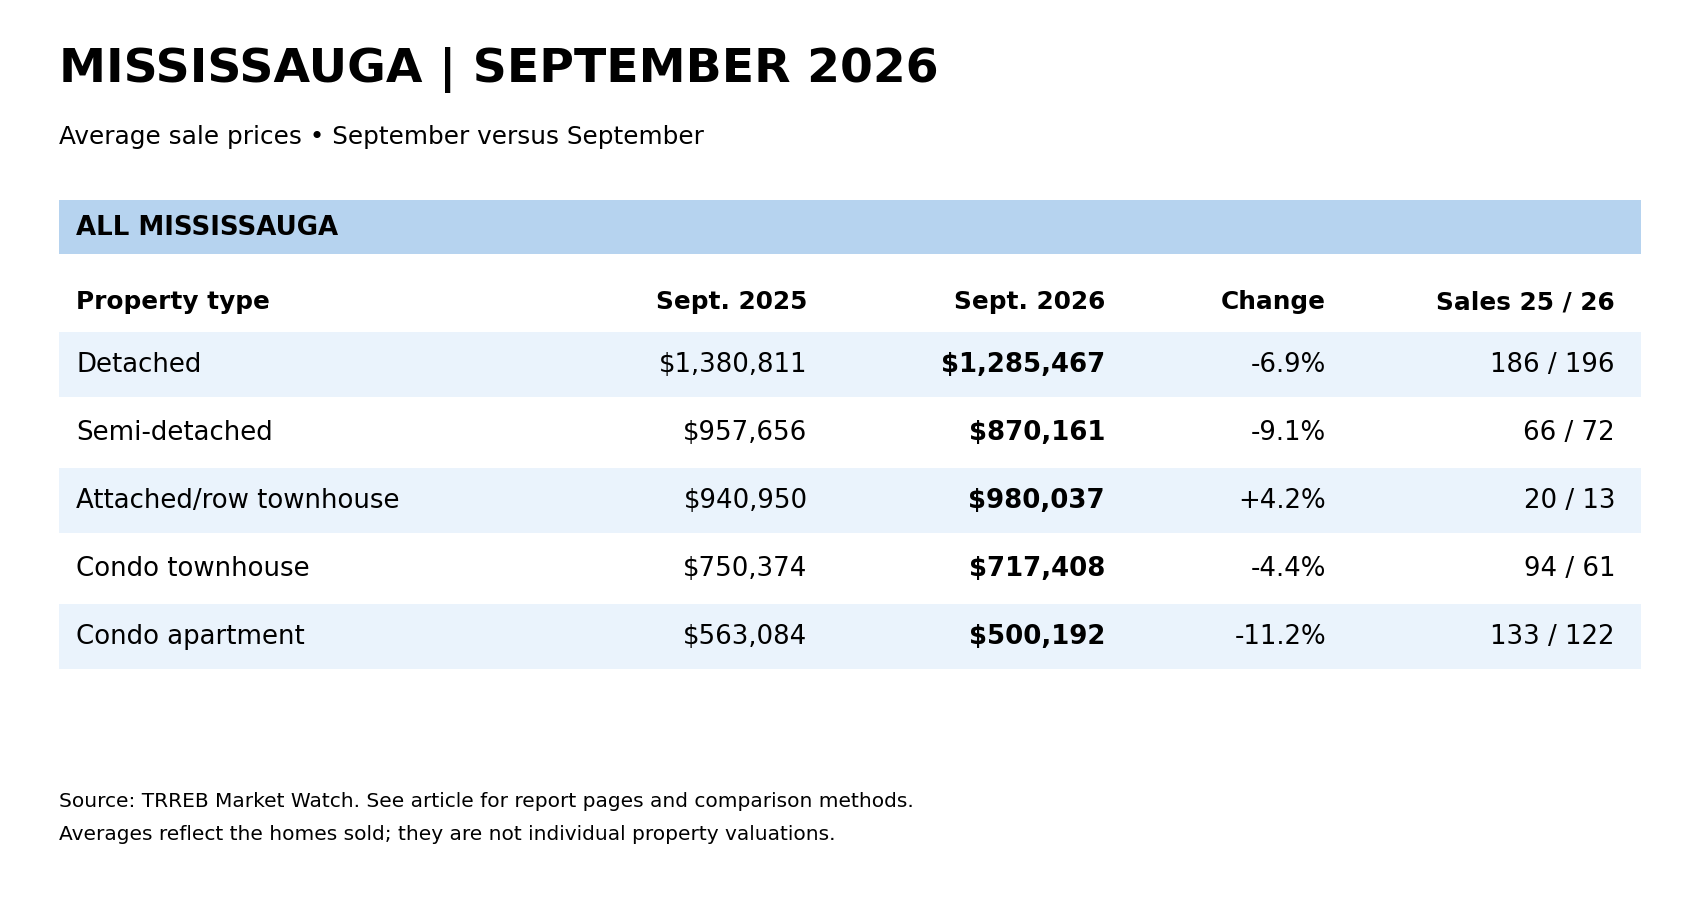
The changes varied by property type. Detached averages fell 6.9% from last September, semi-detached fell 9.1%, and condo apartments fell 11.2%. For sellers, that makes recent comparable sales especially important. For buyers moving from one property type to another, the price difference deserves a closer look.
Attached/row townhouses were the exception in the averages, up 4.2%. But there were only 13 sales, and the median price fell from $926,000 to $898,000. The homes that sold can skew the average.
Etobicoke
Across W06–W10, Etobicoke recorded 275 sales at a calculated combined average of $1,030,235. Sellers added 897 listings, with 1,339 homes available at month-end. Buyers had choices, while sellers needed to understand how their home compared within its own neighbourhood and property type.
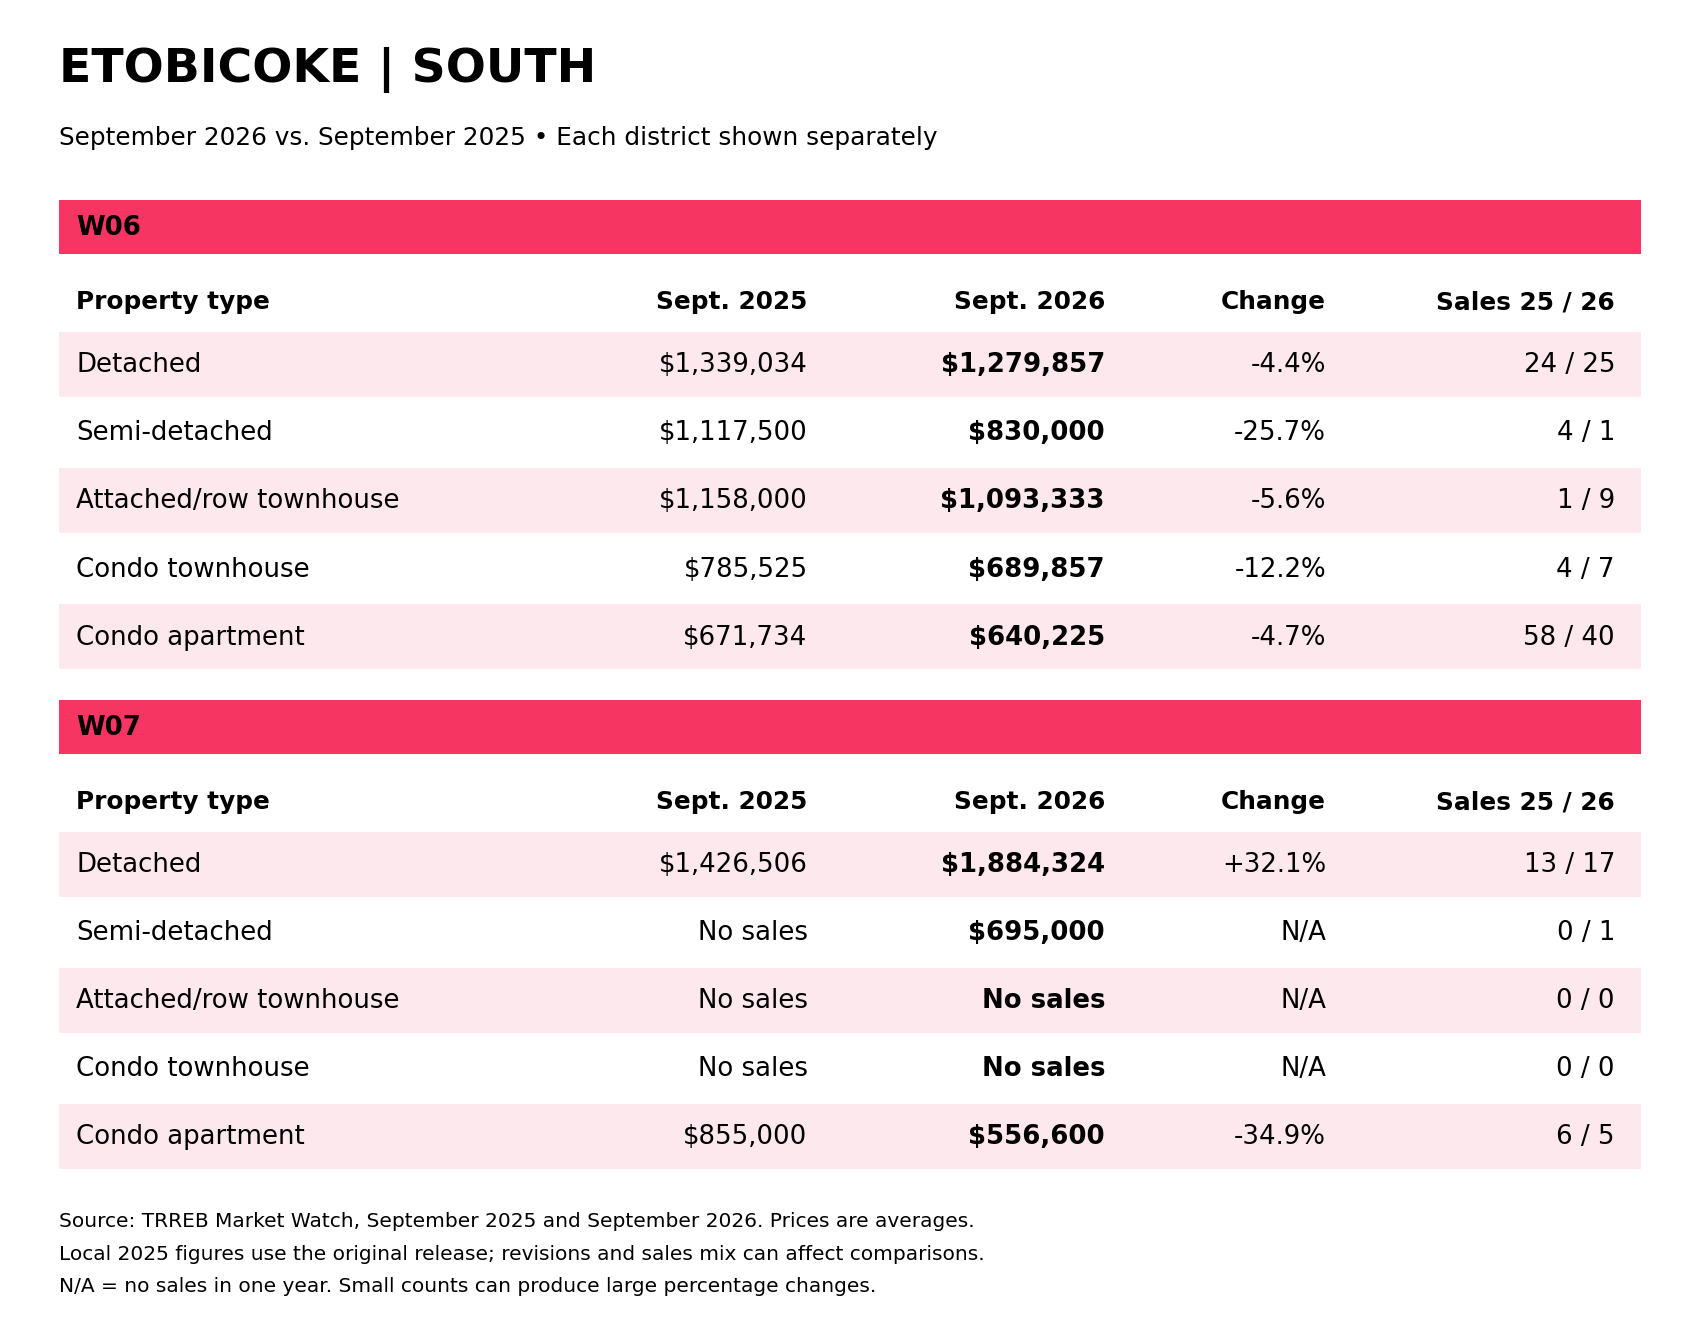
South Etobicoke recorded 105 sales. Its combined detached average rose 11.3%, to approximately $1.525 million, while its condo apartment average fell 8.4%, to approximately $631,000.
That looks promising for detached owners considering a condo nearby. The sales mix matters, though: a larger share of this year’s detached sales came from higher-priced W07. We need to check the actual homes on both sides of your move before deciding how much of that apparent advantage applies to you.
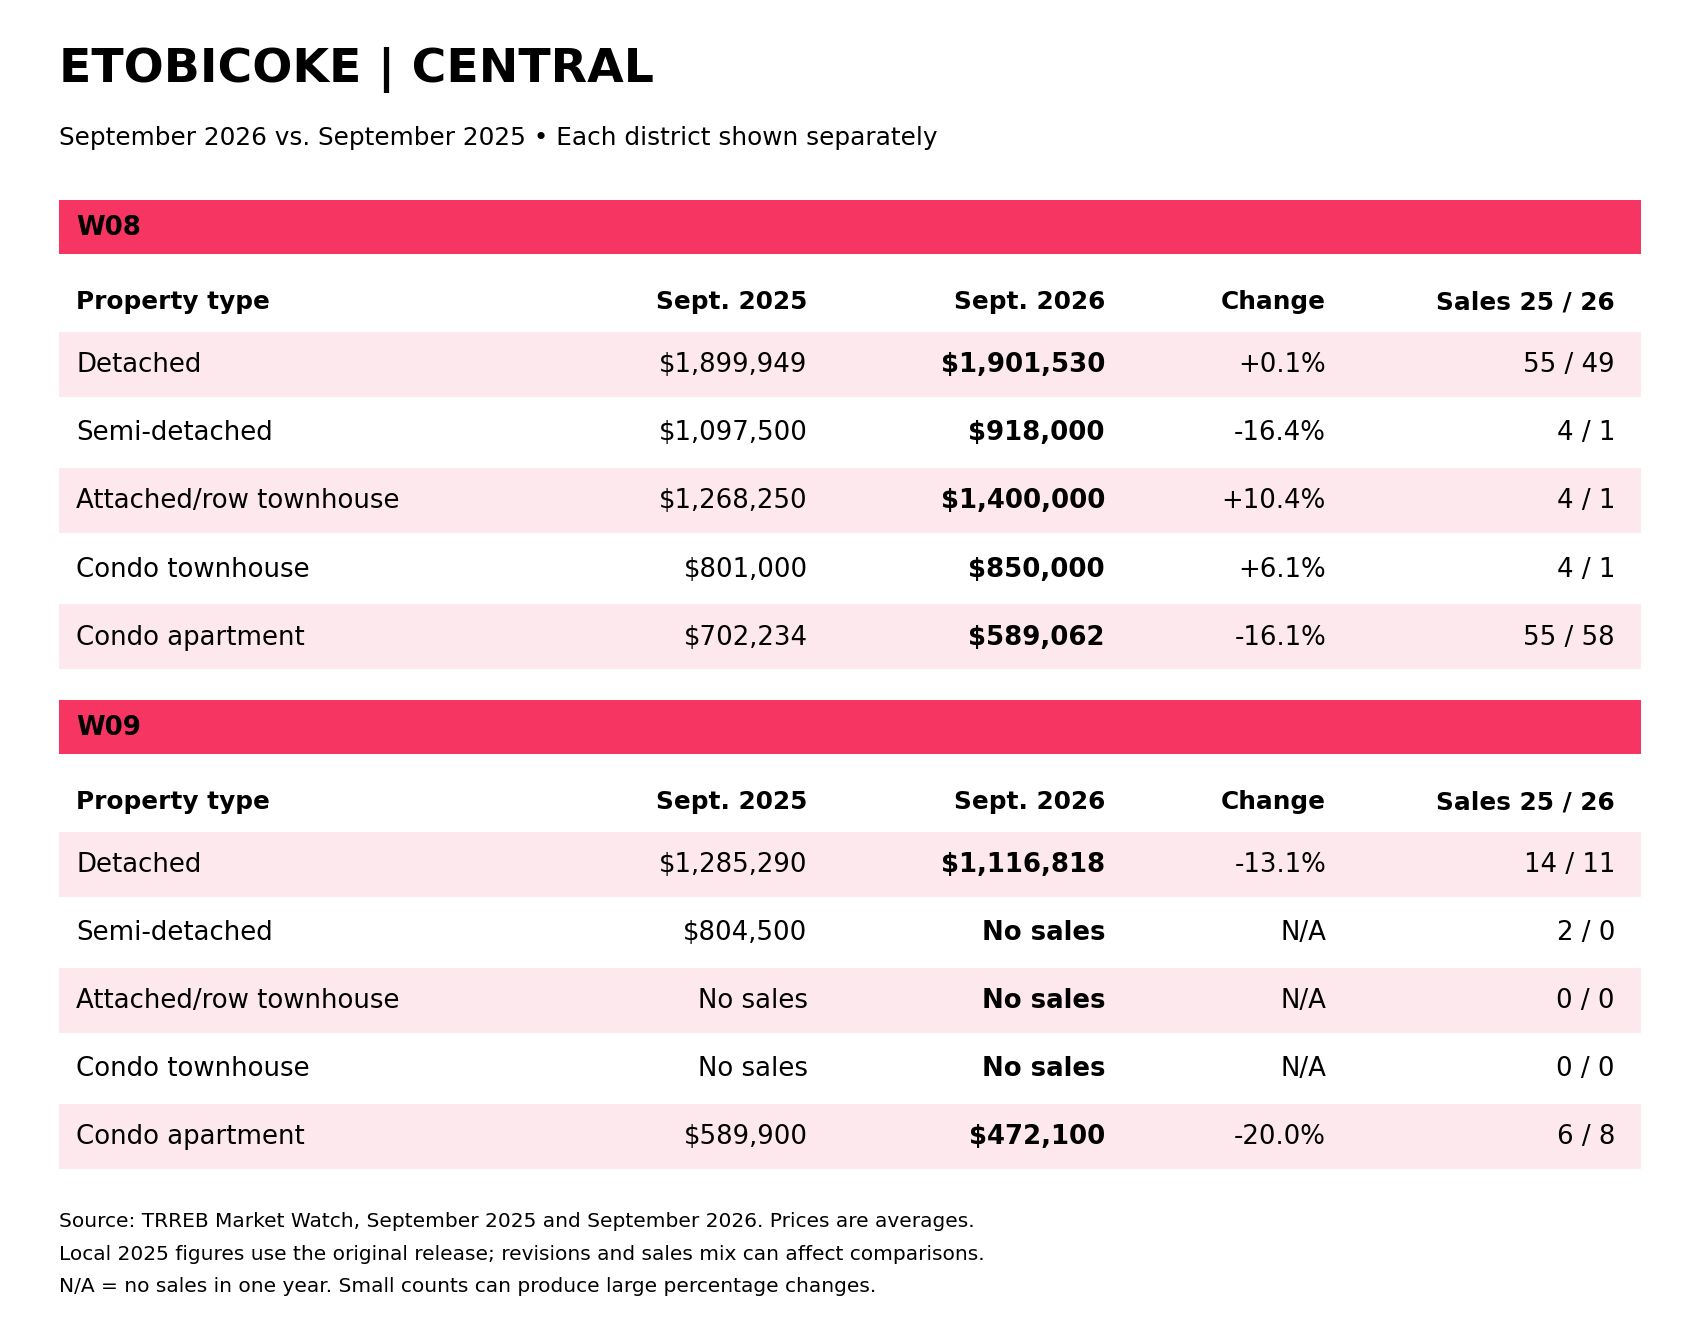
Central Etobicoke recorded 130 sales. Across both districts, detached homes averaged approximately $1.758 million, down 1.0%, while condo apartments averaged approximately $575,000, down 16.8%. That widened the average price spread between detached homes and condos, making this an area worth examining for owners considering a smaller home.
The individual districts tell different stories, which is why the table shows W08 and W09 separately. Several categories had just one sale or none, so their percentage changes need to be read alongside the sales counts.
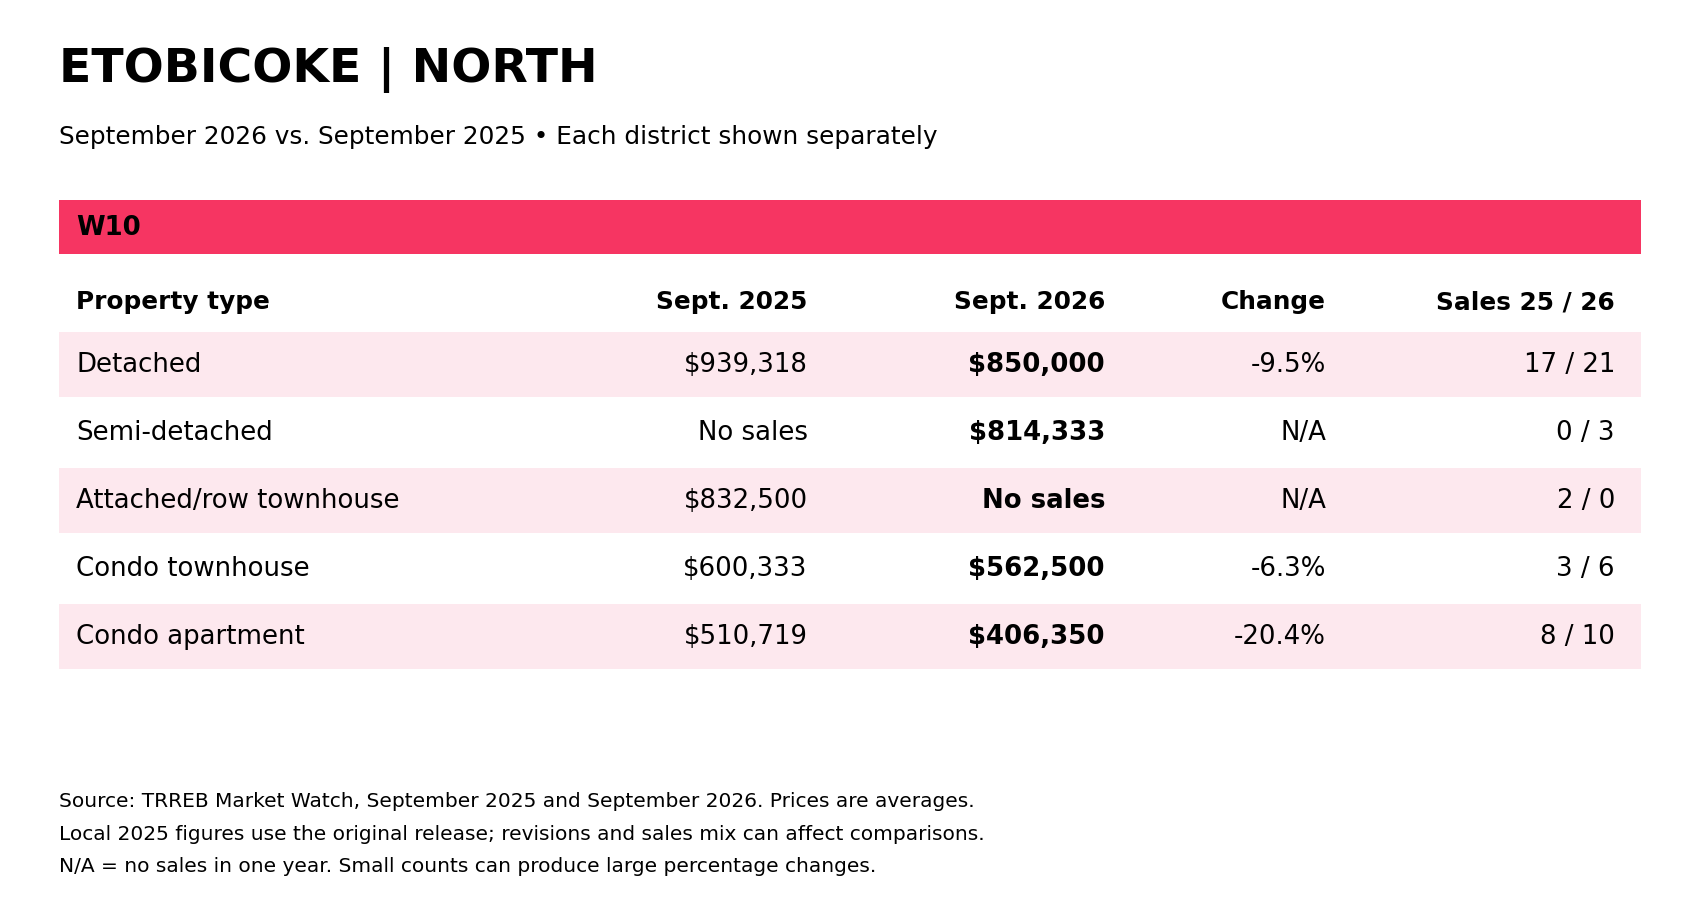
North Etobicoke recorded 40 sales at an overall average of $693,288. Detached homes averaged $850,000, down 9.5% from last September. Condo apartments averaged $406,350, down 20.4%, based on 10 sales this year and eight last year. Buyers have a lower average entry price in this condo segment, but the building, unit size, condition and monthly fees still need to make sense.
Is there an opportunity to move up or downsize?
A lower sale price can still work in your favour if the home you want has fallen further in dollars. Here are the moves September’s numbers suggest are worth investigating.
Moving up in Mississauga
The condo-townhouse-to-detached gap narrowed by about $62,000. Detached averages fell further in dollars than condo-townhouse averages. If you need more space, that is a good reason to price out the move even if your current home would sell for less than last year.
Downsizing
Mississauga condo townhouse owners looking at apartments had a larger average price spread than last year. Central and South Etobicoke detached owners considering a condo also had wider spreads. Those figures describe the difference between sale and purchase prices before moving costs and mortgage repayment.

My experience in real estate and mortgage financing helps put those pieces together. We need a realistic sale price, actual homes you would consider buying, the costs of both transactions and a financing plan that works for you.
Thinking about moving? Let’s look at what’s selling, what’s sitting and where your home fits. We’ll work through both sides of the move so you can see what it would cost, what you could keep and whether the timing makes sense.
Marlon Deogracias | 416-888-9222 | marlon@dreg.ca
DEOGRACIAS REAL ESTATE GROUP INC.
DEOGRACIAS REAL ESTATE GROUP
Marlon Deogracias & Emmy Ha
(416) 888-9222
marlon@dreg.ca
CENTURY 21 Signature Service Brokerage
CENTURY 21 SIGNATURE SERVICE
186 Robert Speck Pkway, Mississauga, ON L4Z3G1
(905) 896-4622
INFO & SERVICES

Independently Owned and Operated. ®/™ trademarks owned by Century 21 Real Estate LLC used under license or authorized sub-license. © 2026 Century 21 Canada Limited Partnership © 2026 Century 21 Canada Limited Partnership
The trademarks MLS®, Multiple Listing Service® and the associated logos identify professional services rendered by REALTOR® members of CREA to effect the purchase, sale and lease of real estate as part of a cooperative selling system. The trademarks REALTOR ® , REALTORS ® and the REALTOR ® logo are controlled by The Canadian Real Estate Association (CREA) and identify real estate professionals who are members of CREA. Used under license. This listing content provided by REALTOR.ca has been licensed by REALTOR® members of The Canadian Real Estate Association. Not intended to solicit properties currently listed for sale or buyers under contract.
Century 21 Canada Limited Partnership currently has franchise opportunities available in select markets across Canada. The intent of this communication is for informational purposes only and is not intended to be a solicitation to anyone under contract with another real estate brokerage operation. This e-mail message contains confidential information intended only for the use of the individual or entity named above. Any unauthorized use or disclosure is strictly prohibited. If you have received this communication in error please immediately delete the e-mail and either notify the sender at the above e-mail address or by telephone.
© 2026 MoxiWorks
